Standard Deviation Calculator
Standard deviation measures how far the numbers in a data set typically sit from their mean. Enter your numbers below to get the sample or population standard deviation, the variance and the mean, with every squared deviation shown step by step.
| Statistic | Value |
|---|
Working
Math Lantern Team · Updated
How standard deviation is calculated
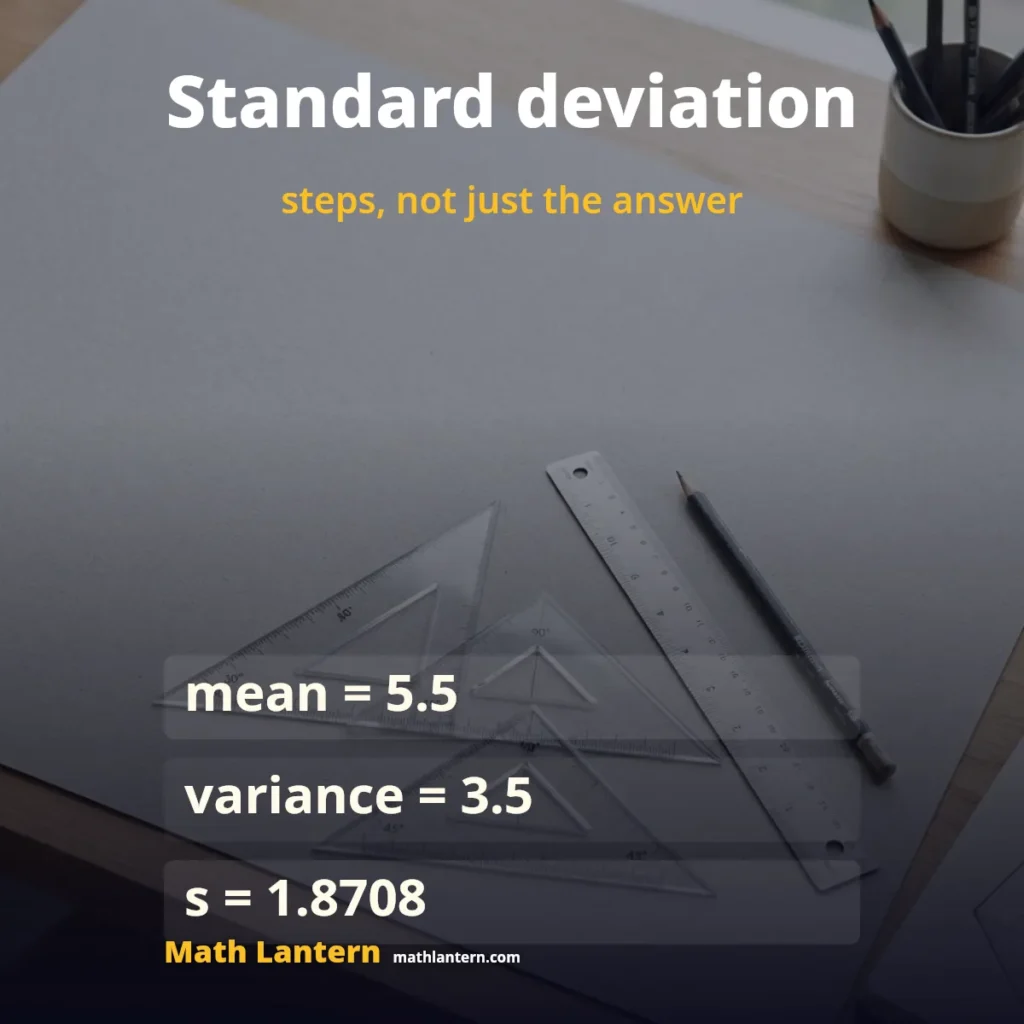
Find the mean, subtract it from each value, square the differences, add them, divide, and take the square root. The only choice is the divisor: use n − 1 for a sample taken from a larger group, and n when your numbers are the whole population.
Worked example: 4, 8, 6, 5, 3, 7
- The six values add up to 33, so the mean is 33 ÷ 6 = 5.5.
- The deviations from the mean are −1.5, 2.5, 0.5, −0.5, −2.5 and 1.5.
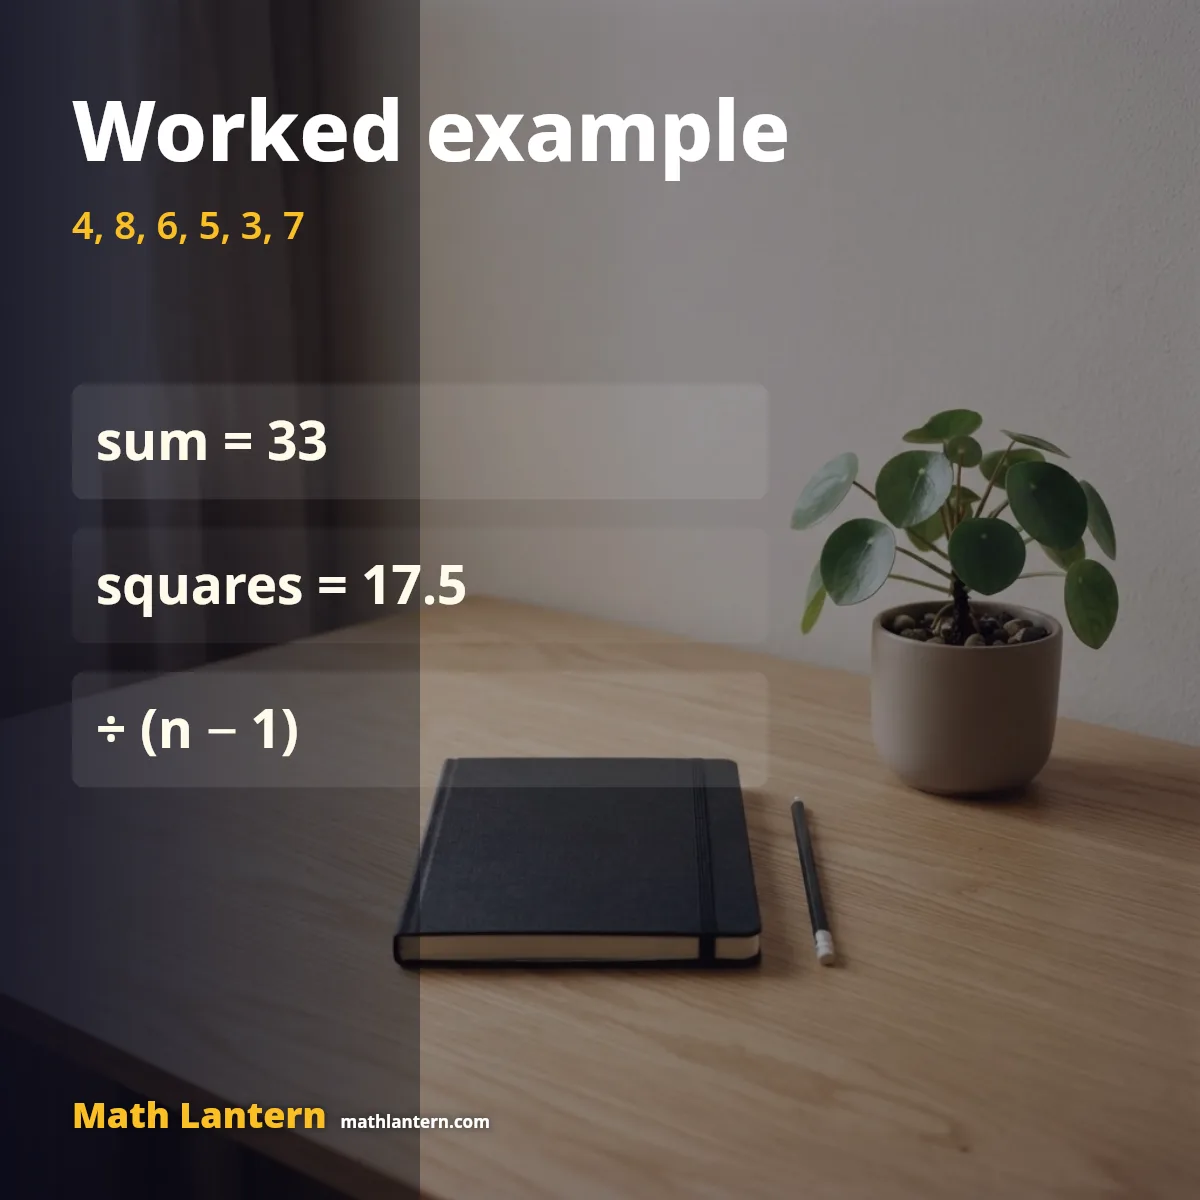
- Squared, they are 2.25, 6.25, 0.25, 0.25, 6.25 and 2.25, which add up to 17.5.
- Sample variance: 17.5 ÷ (6 − 1) = 3.5, so the sample standard deviation is √3.5 = 1.8708.
- Population variance: 17.5 ÷ 6 = 2.9167, so the population standard deviation is √2.9167 = 1.7078.
Sample or population?
If the numbers are a sample, such as the heights of 30 students picked from a school of 900, use the sample formula. Dividing by n − 1 corrects for the fact that a sample tends to sit a little closer to its own mean than to the true mean of the whole group. If you measured every member of the group, use the population formula. Once you have the standard deviation, you can turn any value into a z-score and read its probability from a z value table.
How accurate is the calculator?
All arithmetic runs in your browser in double-precision numbers. On 20 October 2026 the calculator was compared with Python’s statistics module on 200 random lists of 2 to 60 numbers (mean, sample and population variance, median); the largest difference was 5 × 10⁻¹⁶ in relative terms. Very large data sets are limited to 5,000 numbers.
Frequently asked questions
What is the difference between variance and standard deviation?
Variance is the average squared distance from the mean. Standard deviation is its square root, which brings the result back to the same units as your data.
Why do we divide by n − 1 for a sample?
A sample is always a little closer to its own mean than to the true population mean, so dividing by n would underestimate the spread. Using n − 1 corrects for that.
Can standard deviation be negative or zero?
It cannot be negative because it is a square root. It is zero only when every value is exactly the same.
What counts as a high or low standard deviation?
It depends on the units and the mean. A standard deviation of 2 is large for test scores out of 10 but small for house prices. Compare it with the mean or with another data set measured the same way.
Back to the Factoring Calculator home page for other step-by-step tools.
Did this light the way?
Tell us if the steps made sense or where they lost you.
Thanks. That helps us make the next step clearer.